See what every agent contributes
Value metrics in the left rail shows the time your agents save and what that time is worth. Every time an agent uses a skill, the minutes it saved are counted, so the figures grow with every job your agents take off your hands.
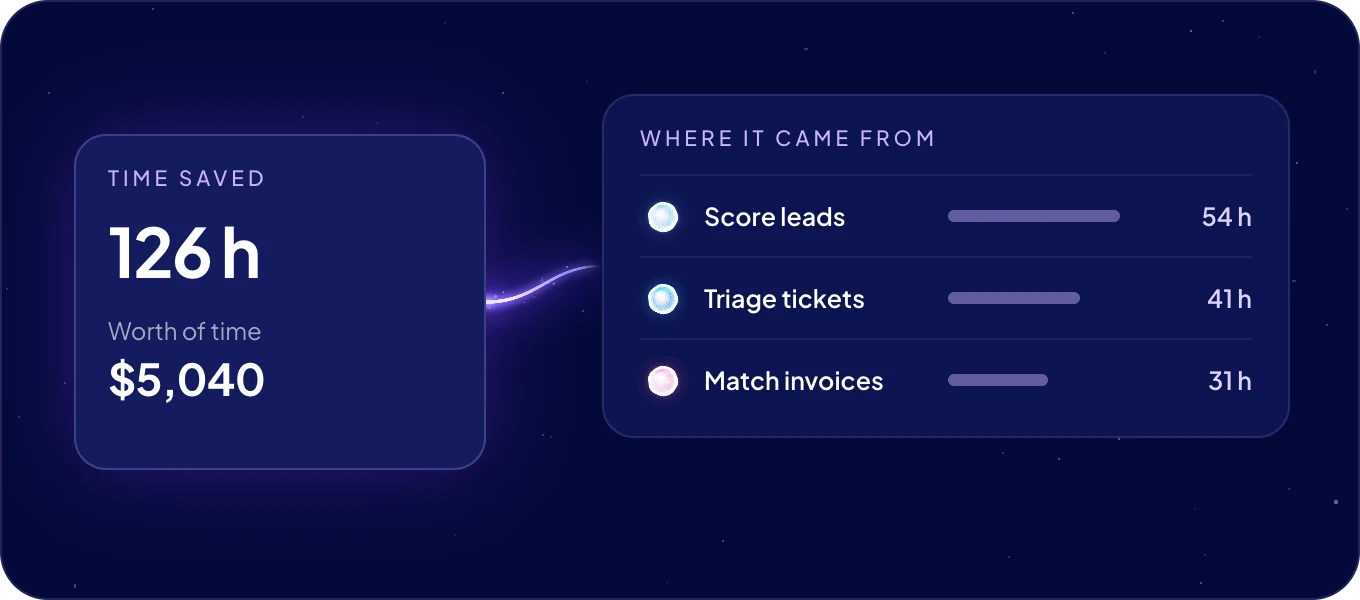
What do the figures mean?
| Figure | What it shows |
|---|---|
| Time saved | The hours of work your agents have done, all time. |
| Worth of time | What those hours are worth at your hourly rate. |
| uses | How many times your agents used their skills, and what this month's AI cost from the AI wallet. |
Set the cost of the AI next to the worth of the time, and you see what your AI team returns.
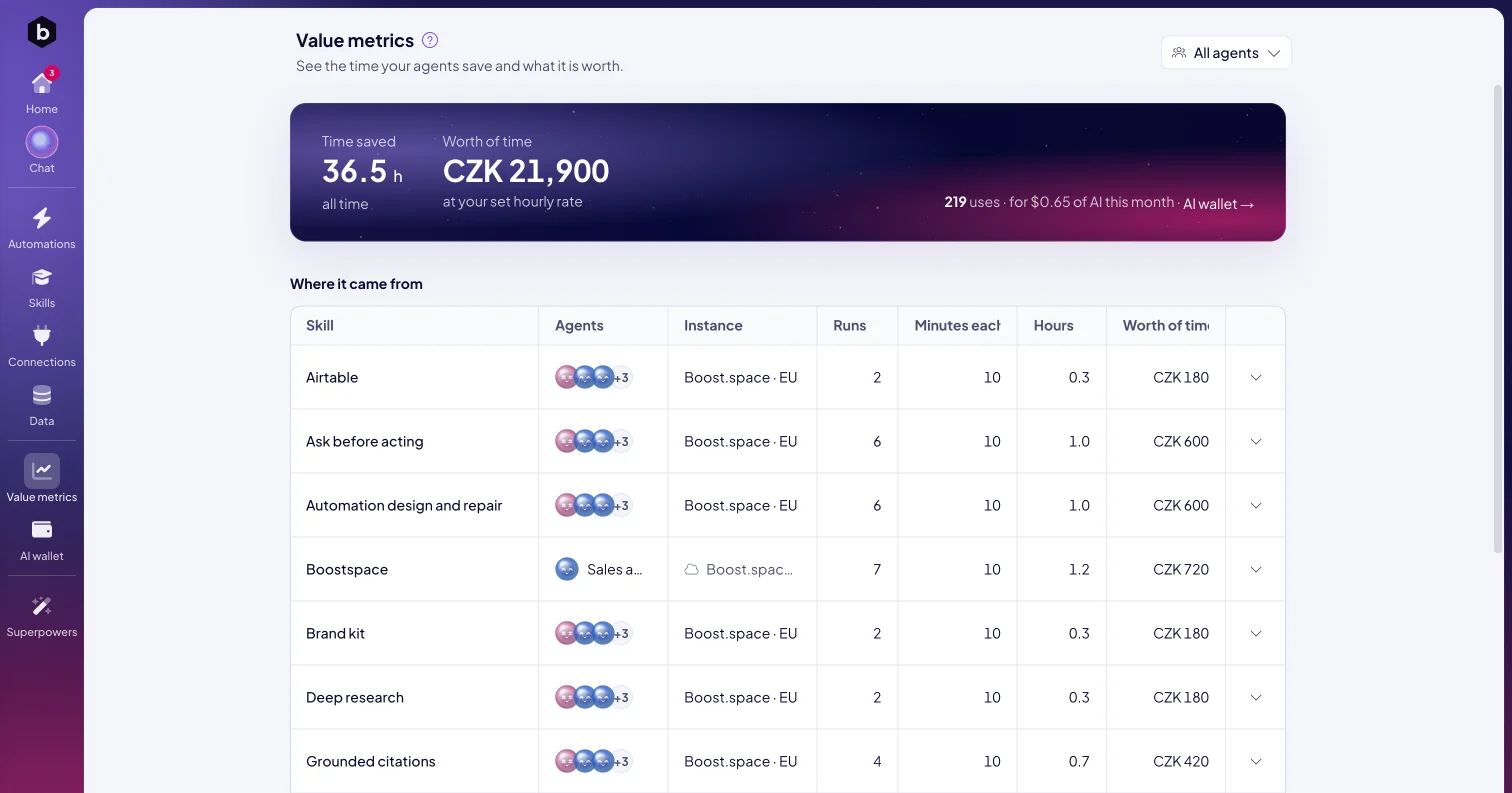
Where does the value come from?
The table Where it came from breaks the figures down by skill:
| Column | What it shows |
|---|---|
| Skill | The skill the agents used. |
| Agents | The agents that used it. |
| Runs | How many times the agents used it. |
| Minutes each | How long the same work takes a person. |
| Hours | The time saved: runs times minutes, in hours. |
| Worth of time | Those hours at your hourly rate. |
With agents on more than one instance, an Instance column shows where each skill ran.
How do I match the figures to my business?
Open a skill's row:
- Set the minutes the work takes by hand in min by hand · this skill. Each skill has its own figure, and a new skill starts at 10 minutes.
- Set your hourly rate. It applies to every skill.
- Click Save these figures.
The figures rest on your own assumptions. Set the minutes and the hourly rate your team really works with, and the result is your real return.
When do the figures start?
With your first agents. Until a task is done, Time saved and Worth of time show Waiting for the first finished task, and each skill joins the table after its first run.
Next: Skills, the know-how your agents' value comes from, or the AI wallet to see the cost side.
